If you don't know Monday yet, I invite you to go to https://github.com/eko/monday to learn more first.
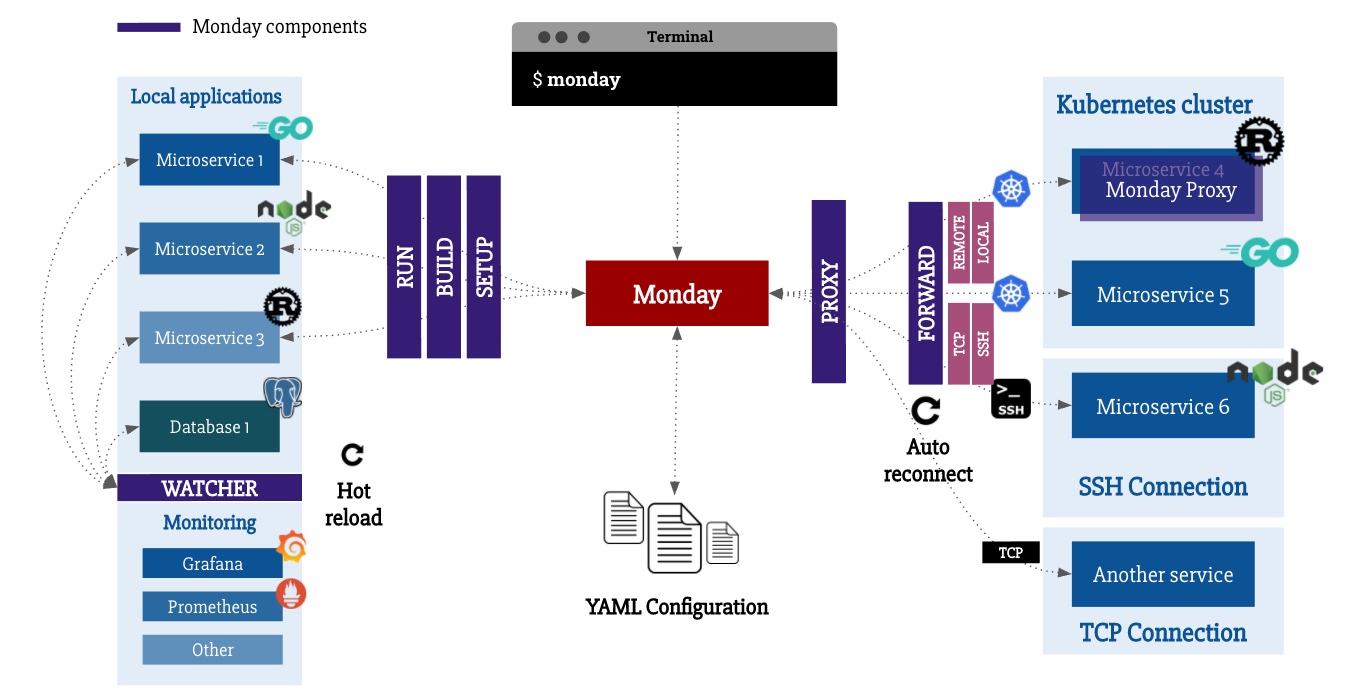
Quickly, it's an open-source tool I developed that allows developers working on several micro-services at the same time to launch "projects", a set of applications launched "locally" and to simulate the execution of others by port-forwarding from a Kubernetes environment, an SSH connection or simply by using TCP proxy.
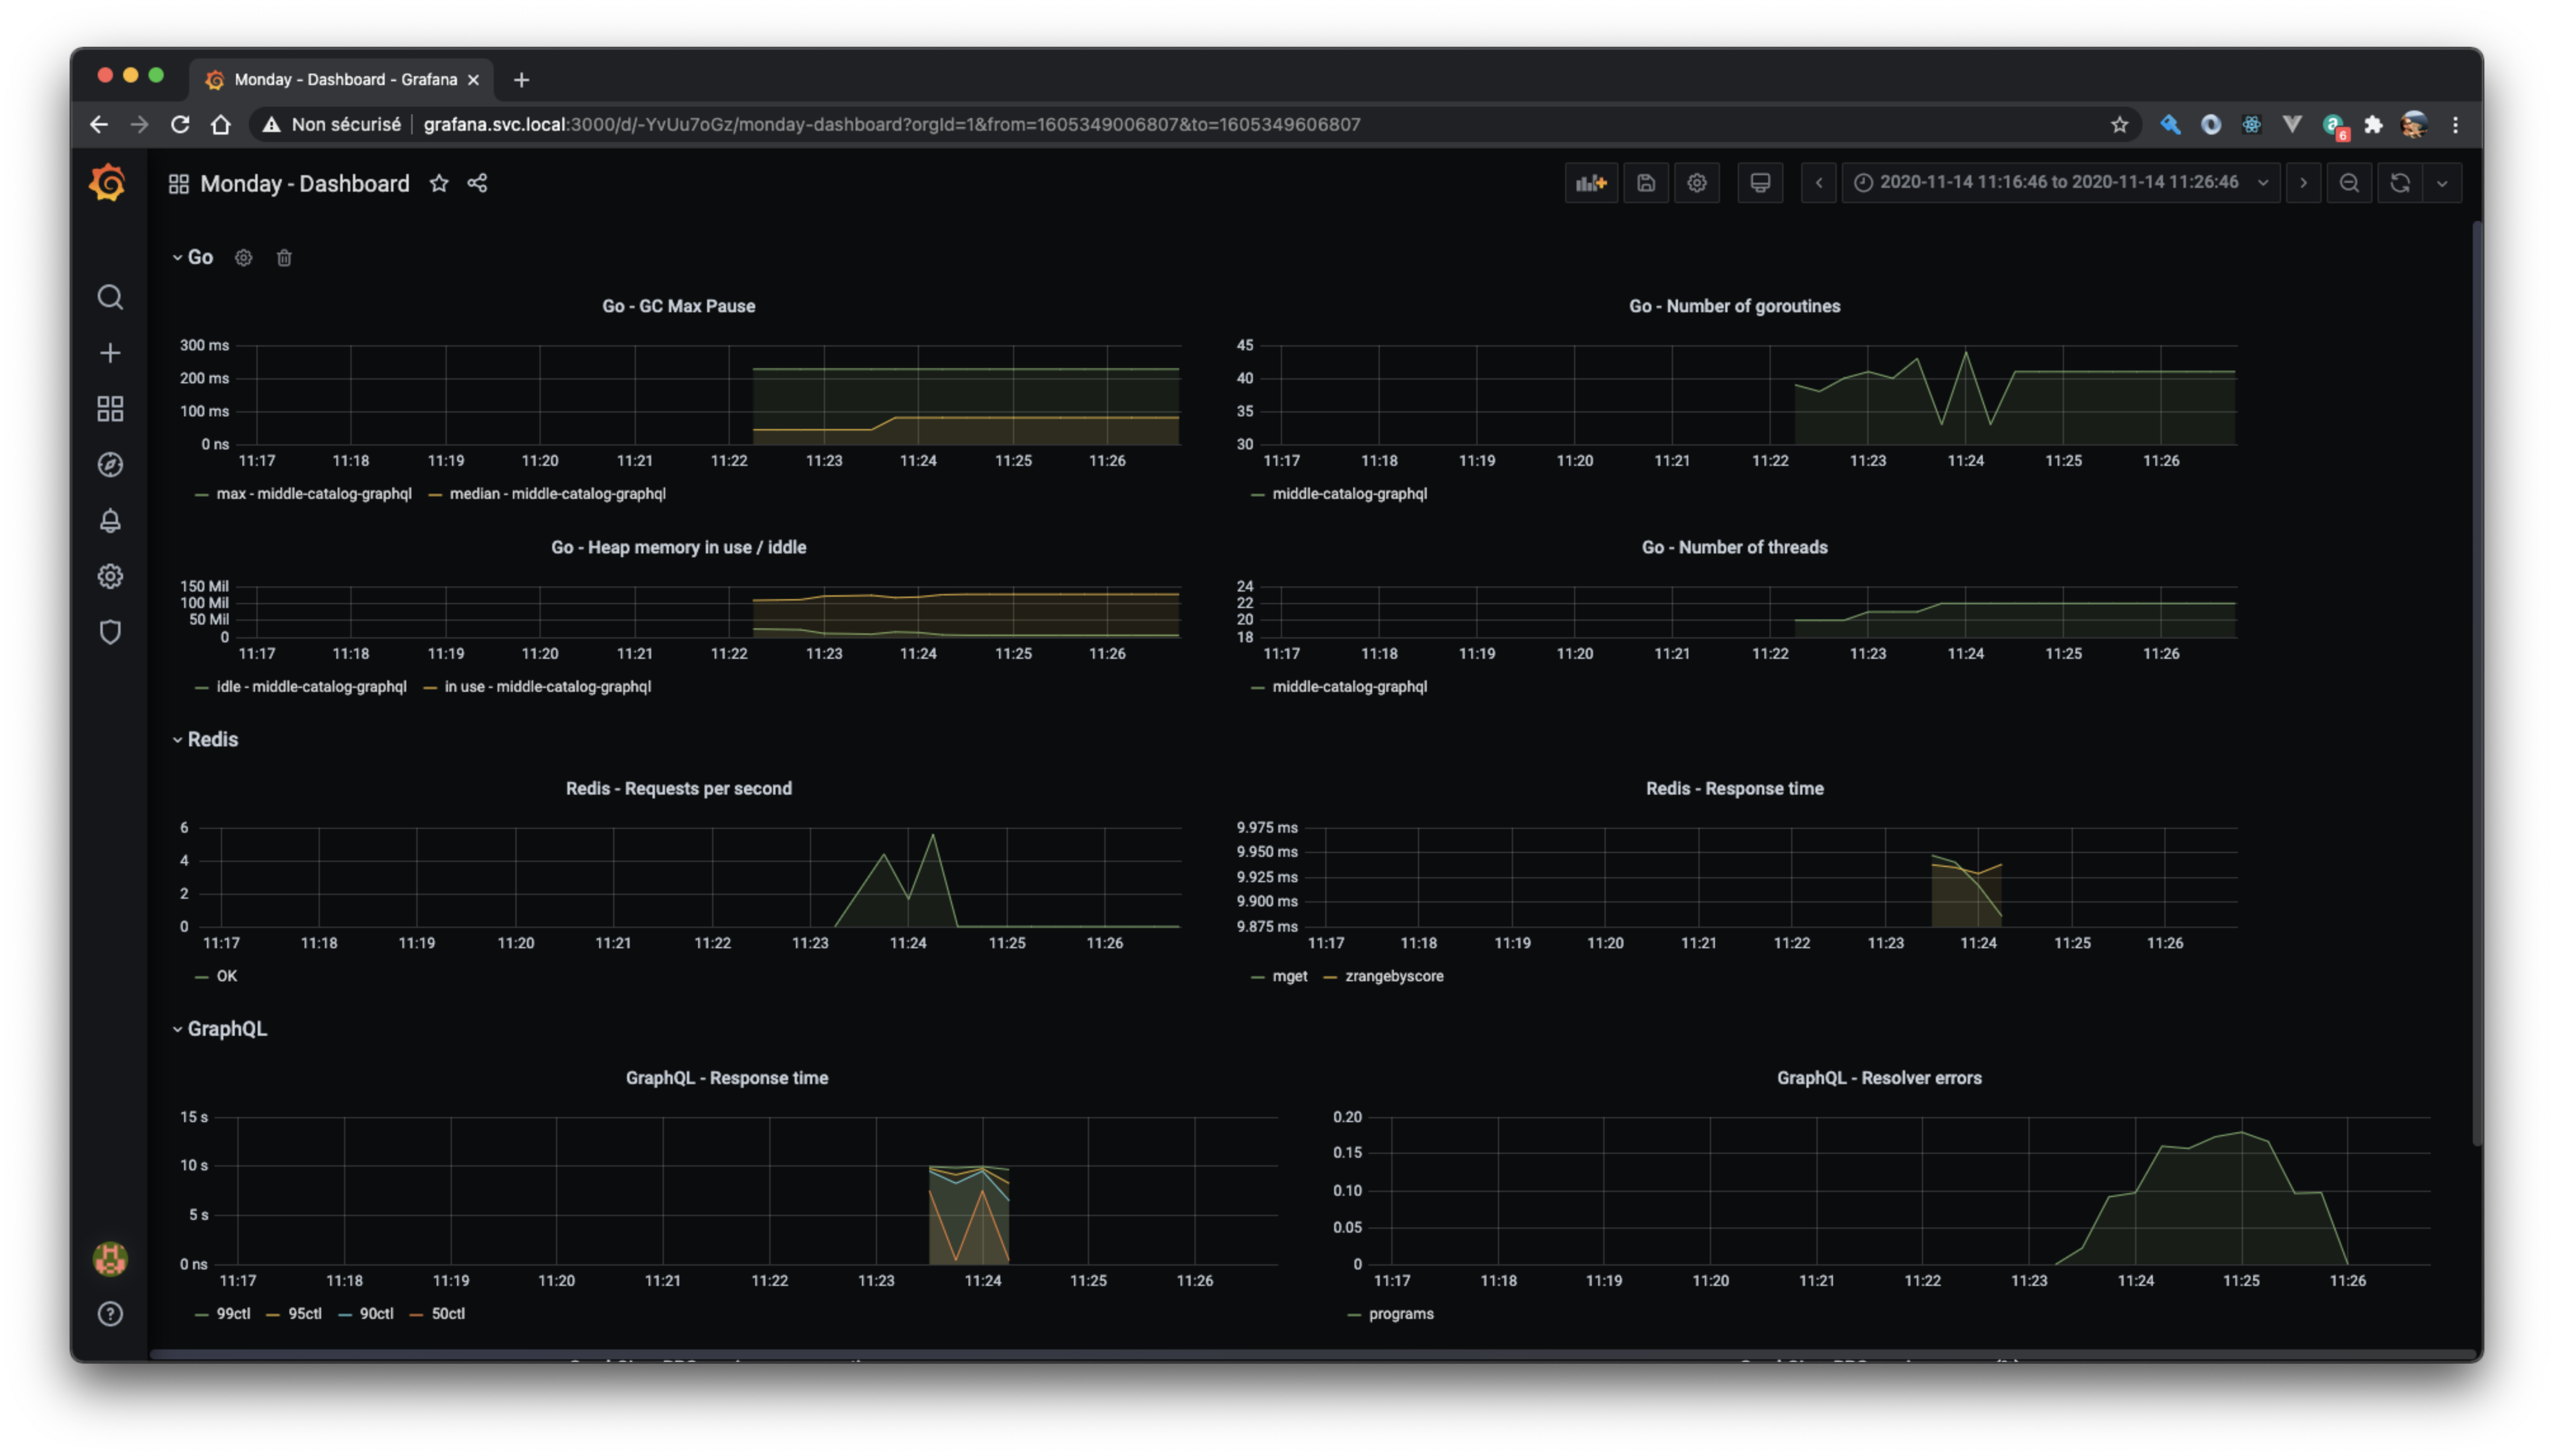
In my opinion there was one feature missing that I think is interesting for developers: to be able to access "monitoring" of their application directly locally.
For most of the clients I've worked with so far, I've used Prometheus as a storage server for time metrics and Grafana for visualization.
So in this article I have written an example to launch this technical monitoring stack but the important thing for me on Monday is to leave as much as possible the hand to the developers and allow them to implement the solution they want.
Also, it seems interesting to me to share with you the steps of reflection for the implementation of this feature, allowing to :
- Make the tool evolve with new features,
- Keep an open behavior, not closing the door to developers for further integrations.
Pre-requisites for the execution of Grafana and Prometheus
After a quick overview of the project, in order to be able to add Grafana and Prometheus and have automatic monitoring, at any time, according to the different service clusters I wanted to launch, I was missing some essential features.
Before starting, a little reminder on how Prometheus and Grafana work with this little schema:

- Prometheus will come and get the metrics of the applications that we will declare in its configuration file,
- Grafana will come and query the Prometheus timeseries database to retrieve the metrics and display them on dashboards that you will have created.
Launch applications globally
So far, one project is reported as follows:
projects:
 - name: project-a
   local:
    - *service-a-local
   forward:
    - *service-b-forward
 - name: project-b
   local:
    - *service-b-local
   forward:
    - *service-c-forward
If I had wanted to add Grafana and Prometheus, I would have had to add them for both projects, this first pull request thus allowed me to add the notion of globality on local and forward applications, so I can now declare at the root of the YAML configuration:
local:
  - *grafana-global
  - *prometheus-global
forward:
  - *graylog-forward-kubernetes
Simple, efficient, local applications or port-forward can now be performed in all cases.
Being able to generate configuration files
As Grafana and Prometheus could now be executed, it was now necessary to generate the following configuration files :
- Prometheus: list the applications for which the metrics have to be retrieved (scrapping),
- Grafana: declare the URL of the Prometheus server as data source (datasource).
These two needs represent in fact a single requirement: to be able to declare files for a local application, and to be able to dynamically generate these files from the values provided in the user's configuration.
The text/template package from Go was very useful for this feature, as you can see in the following pull request.
It allows the use of a syntax to browse a Go object or to add functions that can be used in the template.
To write a template, nothing could be simpler:
content := `
{{- range $app := .Applications }}
Application: {{ $app.Name }}
{{- end }}
`
t := template.Must(template.New("/my/output/file").Parse(content))
_ = t.Execute(f, project) // project est ici la struct représentant le projet courant
So, for the project-a given above, the output in the /my/output/file here corresponds to the name given to my local service-a application:
Application: Service A
With this feature in place, we are now able to declare, for local applications, a files section allowing to generate configuration files, like the Prometheus one for example:
<: &prometheus-global
  name: prometheus
  ...
  files:
    - type: content
      to: ~/.monday/prometheus-2.22.1.darwin-amd64/prometheus.yml
      content: | # Prepare the Prometheus configuration with all services that have to be scrapped from monday
        global:
          scrape_interval:     15s
          evaluation_interval: 15s
        scrape_configs:
          {{- range $app := .Applications }}
          {{- if $app.Monitoring }}
          - job_name: '{{ $app.Name }}'
            static_configs:
              - targets: ['{{ $app.Hostname }}:{{ $app.Monitoring.Port }}']
            metrics_path: {{ $app.Monitoring.URL }}
          {{- end }}
          {{- end }}
The same functionality is used to create the necessary Grafana configurations.
Setting up the monitoring
We now have all the necessary features!
The last pull request consisted only in adding in the YAML configuration entries a monitoring section (used in the Prometheus configuration template just before) in order to be able to declare for each application, on which hostname / port and URL Prometheus should fetch the data.
On an application, we just need to add the following sections:
<: &service-a-local
  name: Service A
  ...
  hostname: service-a.svc.local
  monitoring:
    port: 8001
    url: /metrics
Note that it is also possible to specify this configuration on a forward type application, after all you can also access their metrics, even if they are not directly executed at home, why deprive yourself?
Here are the complete configurations for Grafana and Prometheus allowing you to add monitoring to your local micro-services:
Monday configuration for Prometheus
# Defines Prometheus server setup steps and configuration files
<: &prometheus-global
  name: prometheus
  path: ~/.monday/prometheus-2.22.1.darwin-amd64
  hostname: "prometheus.svc.local"
  setup:
    commands:
      - mkdir -p ~/.monday/download
      - curl -Lo ~/.monday/download/prometheus.tar.gz https://github.com/prometheus/prometheus/releases/download/v2.22.1/prometheus-2.22.1.darwin-amd64.tar.gz
      - tar -xzvf ~/.monday/download/prometheus.tar.gz --directory ~/.monday/
      - rm -rf ~/.monday/download/prometheus*
  run:
    command: ./prometheus
  files:
    - type: content
      to: ~/.monday/prometheus-2.22.1.darwin-amd64/prometheus.yml
      content: | # Prepare the Prometheus configuration with all services that have to be scrapped from monday
        global:
          scrape_interval:     15s
          evaluation_interval: 15s
        scrape_configs:
          {{- range $app := .Applications }}
          {{- if $app.Monitoring }}
          - job_name: '{{ $app.Name }}'
            static_configs:
              - targets: ['{{ $app.Hostname }}:{{ $app.Monitoring.Port }}']
            metrics_path: {{ $app.Monitoring.URL }}
          {{- end }}
          {{- end }}
Configuration Monday for Grafana
# Defines Grafana setup steps and configuration files
<: &grafana-global
  name: grafana
  path: ~/.monday/grafana-7.1.5
  hostname: "grafana.svc.local"
  setup:
    commands:
      - mkdir -p ~/.monday/download
      - curl -Lo ~/.monday/download/grafana.tar.gz https://dl.grafana.com/oss/release/grafana-7.1.5.darwin-amd64.tar.gz
      - tar -xzvf ~/.monday/download/grafana.tar.gz --directory ~/.monday/
      - rm -rf ~/.monday/download/grafana*
  run:
    command: ./bin/grafana-server web
  files:
    - type: content
      to: ~/.monday/grafana-7.1.5/conf/provisioning/datasources/prometheus.yml
      content: | # Specify the Prometheus datasource in Grafana
        apiVersion: 1
        datasources:
          - name: prometheus
            type: prometheus
            access: proxy
            url: http://prometheus.svc.local:9090
    - type: content
      to: ~/.monday/grafana-7.1.5/conf/provisioning/dashboards/monday.yml
      content: | # In case you want to provision some dashboards, specify the path
        apiVersion: 1
        providers:
          - name: 'monday'
            orgId: 1
            folder: ''
            type: file
            disableDeletion: false
            editable: true
            options:
              path: $HOME/.monday/grafana-7.1.5/conf/provisioning/dashboards
    - type: copy # In case you want to prepare a Grafana dashboard that will be provisionned with Grafana
      from: ~/.monday/grafana-dashboard.json
      to: ~/.monday/grafana-7.1.5/conf/provisioning/dashboards/dashboard.json
Note: if you're on linux, remember to change
darwintolinux.
Conclusion
Note that with the declaration of setup steps, a developer on the team will simply have to copy these new configurations and both Prometheus and Grafana will be automatically installed and run when using Monday.
He will then be able to access his Grafana interface by going to http://grafana.svc.local:3000 and, if necessary, Prometheus via http://prometheus.svc.local:9090.